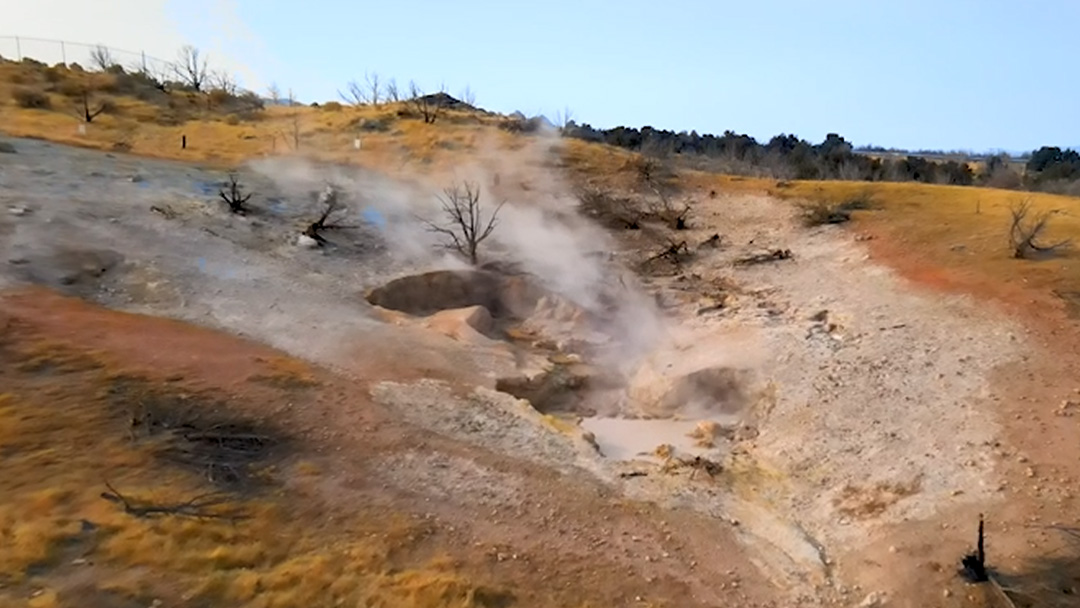
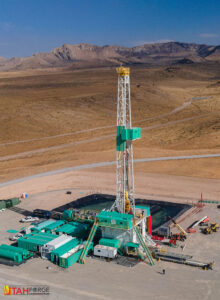
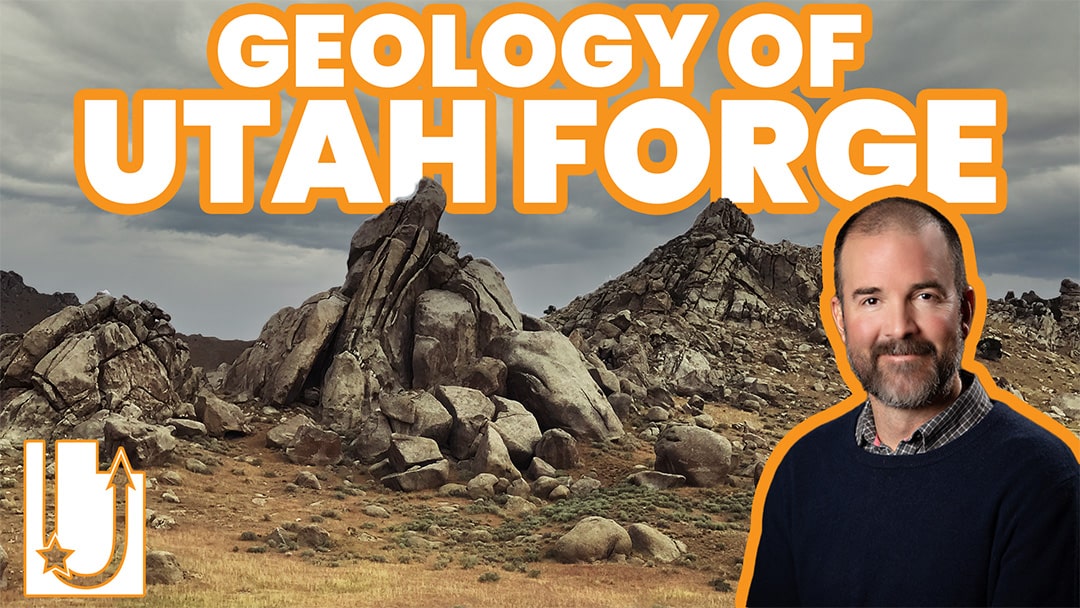
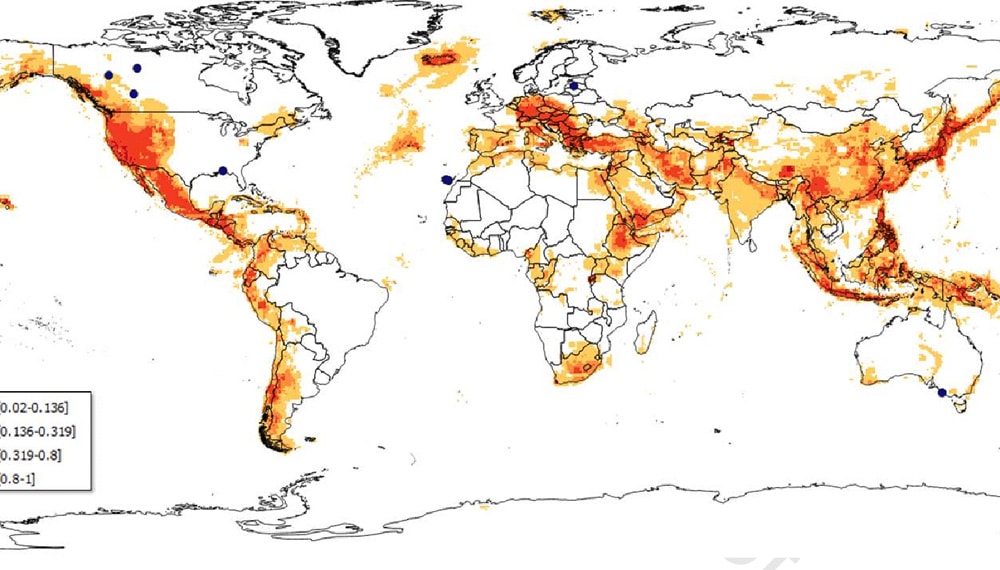
The heat beneath our feet flows through the earth in a complex pattern. Utah FORGE is situated in a heat reservoir that has been studied since the 1970s. In this webinar, Dr. Stuart Simmons delves into the unique geologic and geothermal resources found at Utah FORGE and the surrounding area.
