The Energy & Geoscience Institute announces Dr. Kristie McLin as Director of Research and Science and new Principal Investigator of the Utah FORGE project, succeeding Dr. Joseph Moore.


Earth modeling data are in SI units and in UTM, Zone 12N, NAD83, NAVD88 referenced coordinates.
Utah FORGE Site data are available on the Geothermal Data Repository.

In partnership with Seequent an interactive viewer of the earth model of the Milford Site and surrounding area was developed using Leapfrog Geothermal. The datasets represent the subsurface, well locations, and microseismicity from the 2020 stimulation of well 16A(78)-32.
Earth modeling data are in SI units and in UTM, Zone 12N, NAD83, NAVD88 referenced coordinates.
Utah FORGE Site data are available on the Geothermal Data Repository.
Best viewed on desktop. Mobile devices open in a new tab.

Scroll for more ↓
Once the scene is open, use the following interaction tools to navigate and analyze the 3D environment.
Navigation
You can use a mouse or keyboard shortcuts to move through the scene.
Key Tools & Analysis
Data Attributes
Scroll for more ↓
Once the scene is open, use the following interaction tools to navigate and analyze the 3D environment.
Navigation
You can use a mouse or keyboard shortcuts to move through the scene.
Key Tools & Analysis
Data Attributes
The Utah FORGE Modeling and Simulation Forum was created to communicate the role of the Utah FORGE Modeling Team in the research and development of the Utah FORGE site during Phase 3 of the project.
Known as the “Utah FORGE M&S Community Update,” the forum brought together the Utah FORGE modeling team and the broader modeling community to discuss ongoing efforts, successes, and challenges.
January 19, 2022
2021 Utah FORGE modeling summary and 2022 look ahead – Presented by Robert Podgorney (INL)
December 15, 2021
Impact of injection rate ramp-up on nucleation and arrest of dynamic fault slip – Presented by Federico Ciardo (ETH-Zurich)
November 17, 2021
Hybrid fracture/matrix modeling for well completion options evaluation – Presented by Lynn Munday and Somayajulu L. N. Dhulipala (INL)
October 20, 2021
Ground acceleration modeling from potential induced seismicity – Presented by Chandrakanth Bolisetti (INL)
September 15, 2021
Utah FORGE site field update and Utah FORGE 16A-78-32 stimulation modeling – Presented by Aleta Finnila (Golder) and Branko Damjanac (Itasca)/Pengju Xing (UofU)
August 18, 2021
Microseismic monitoring and risk mitigation plan for the first Utah FORGE stimulations at the toe of 16A-32 – Presented by Ben Dyer (GeoEnergie Suisse)
July 21, 2021
Utah FORGE DFN model file availability on GDR – Presented by Aleta Finnila (Golder)
May 19, 2021
An overview of Modeling and Simulation related to Utah FORGE research awards – Presented by Robert Podgorney
January 20, 2021
Accessing Heat and Fluid Flow in Doublet Enhanced Geothermal System (EGS) – Presented by Pranay Asai and Robert Podgorney
October 28, 2020
Back-analysis of injection tests in zone 2 on well 58-32 – Presented by Branko Damjanac, Pengju Xing, John McLennan
August 19, 2020
Coupled Simulations of Well and Reservoir Thermal Hydraulics – Presented by Rob Podgorney and David Andrs (INL)
June 17, 2020
Injection Testing and Stress Measurements – Presented by Pengju Xing (EGI) & John McLennan (EGI)
May 20, 2020
Hydraulic Fracture Stimulation Patterns in the FORGE Reservoir Using Multiple Stochastic DFN Realizations and Variable Stress Conditions – Presented by Aleta Finnila (Golder)
April 15, 2020
Modeling and Simulation Forum: Introduction and Overview – Presented by Rob Podgorney (INL)
A numerical implementation of the conceptual and earth models has been developed of the FORGE reservoir and surrounding area to estimate the spatial distribution of native state pressure, temperature, and stress conditions. The primary goal of this effort was threefold.
The data and results included here are from the reference models completed in November 2019, at the approximate end of Phase 2. A complete report on the Phase 2 Modeling and Simulation can be found here.
 |
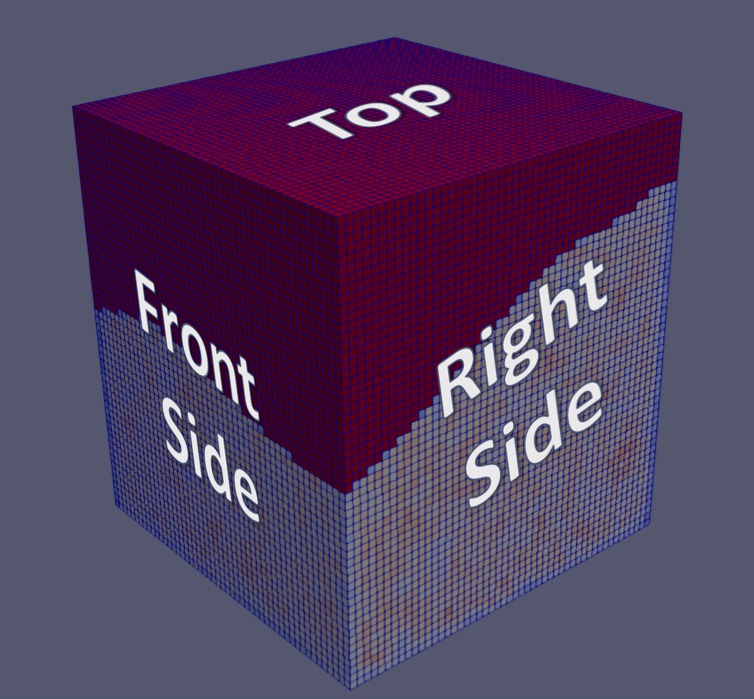
The Phase 3 numerical model domain sized to enclose a volume of the reservoir intersected by Wells 56-32, 58-32, 16A, 78B-32, and 78-32 and a significant subsurface volume below the FORGE site footprint. The model domain of 4.0 km x 4.0 km x 4.2 km is located approximately between depths of 4000 to 4200 meters below land surface. A nonuniform mesh spacing of average 40 m was used, with a total of 0.24 million tetrahedron elements. Finite element mesh of the model can be downloaded here. The image to the left shows the model geometries, the upper sedimentary layer (red), the lower granitoid layer mesh. This image also presents the global coordinate system where Z-axis is along vertical direction and X-axis is along the minimum horizontal direction. |
 |
The Phase 2 numerical model domain sized to enclose a volume of the reservoir intersected by Well 58-32 and a significant subsurface volume below the FORGE site footprint. The model domain of 2.5 km x 2.5 km x 2.75 km is located approximately between depths of 400 to 3200 meters below land surface and aligned with the principle stress direction. A uniform mesh spacing of 50 m was used, with a total of 137,500 grid cells. Meshes were formulated in both UTM and a local coordinate systems, and can be downloaded here. The image to the left shows the boundaries of model domain (gray box), the Utah FORGE site outline projected into the subsurface (red), and the top of the granitoid surface colored by temperature. |
 |
The lithology at the site was divided into two broadly defined units, consisting of crystalline granitic basement rock (granitoid) and the overlying sedimentary basin fill. Vertices of points defining the contact surface can be downloaded here. The contact surface interpolated onto the numerical model mesh can be downloaded here. The image to the left shows the land surface (gray), the Utah FORGE site outline projected into the subsurface (red), and the top of the granitoid surface (green). |
 |
Both native static and transient models are based on complex coupled pore fluid flow, thermal, and solid field equations. The setup on appropriate boundary conditions for each field equation are critical to solving such a complex multiphysical problem. Boundary conditions for native static model were based on results obtained and compiled during Phase 3, which relied on both new data collection and information obtained from field tests and the literature. Specifically, based on field well tests, the direction of the maximum principle stress has been evaluated not along the vertical direction. This complicates stress field boundary conditions as the traction in shear component besides of the normal traction should be included in the model. Boundary Conditions coupled three: a) Boundary conditions for the fluid flow field equation:
b) Boundary conditions for the thermal field equation:
c) Boundary conditions for the stress field equation:
By applying these boundary conditions and gravity (body force), the solution from native static model provides an initial conditions including pore pressure, temperature, and stress for further transient analysis where fluids are injected through wellbores. |
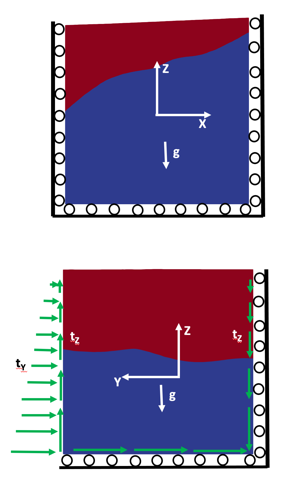 |
The image ‘Boundary Conditions coupled three’ demonstrates boundary conditions for coupled three field equations. A more detailed displacement and traction boundary conditions for the stress field are plotted in 2D in the image. |
Fracture Intensity:
| Description | P32 [1/m] | [%] |
| South striking moderately dipping west | 0.42 | 36.10% |
| East striking steeply dipping south | 0.35 | 30.10% |
| SSW striking vertical | 0.19 | 16.60% |
| North striking steeply dipping east | 0.2 | 17.20% |
| 1.15 | 100.00% |
Orientation:
| Mean Trend | Mean Plunge | Mean Strike | Mean Dip | Fisher Concentration | Description |
| 88.5 | 46 | 178.5 | 44 | 15 | South striking moderately dipping west |
| 1.5 | 13.5 | 91.5 | 76.5 | 30 | East striking steeply dipping south |
| 131 | 5 | 221 | 85 | 30 | SSW striking vertical |
| 260 | 17 | 350 | 73 | 10 | North striking steeply dipping east |
|
The Phase 3 numerical model domain sized to enclose a volume of the reservoir intersected by Wells 56-32, 58-32, 16A, 78B-32, and 78-32 and a significant subsurface volume below the FORGE site footprint. The model domain of 4.0 km x 4.0 km x 4.2 km is located approximately between depths of 4000 to 4200 meters below land surface. A nonuniform mesh spacing of average 40 m was used, with a total of 0.24 million tetrahedron elements. Finite element mesh of the model can be downloaded here. The image above shows the model geometries, the upper sedimentary layer (red), the lower granitoid layer mesh. This image also presents the global coordinate system where Z-axis is along vertical direction and X-axis is along the minimum horizontal direction. |
|
The image to the left shows the boundaries of model domain (gray box), the Utah FORGE site outline projected into the subsurface (red), and the top of the granitoid surface colored by temperature. |
|
The lithology at the site was divided into two broadly defined units, consisting of crystalline granitic basement rock (granitoid) and the overlying sedimentary basin fill. Vertices of points defining the contact surface can be downloaded here. The contact surface interpolated onto the numerical model mesh can be downloaded here. The image to the left shows the land surface (gray), the Utah FORGE site outline projected into the subsurface (red), and the top of the granitoid surface (green). |
|
Both native static and transient models are based on complex coupled pore fluid flow, thermal, and solid field equations. The setup on appropriate boundary conditions for each field equation are critical to solving such a complex multiphysical problem. Boundary conditions for native static model were based on results obtained and compiled during Phase 3, which relied on both new data collection and information obtained from field tests and the literature. Specifically, based on field well tests, the direction of the maximum principle stress has been evaluated not along the vertical direction. This complicates stress field boundary conditions as the traction in shear component besides of the normal traction should be included in the model. Boundary Conditions coupled three: a) Boundary conditions for the fluid flow field equation:
b) Boundary conditions for the thermal field equation:
c) Boundary conditions for the stress field equation:
By applying these boundary conditions and gravity (body force), the solution from native static model provides an initial conditions including pore pressure, temperature, and stress for further transient analysis where fluids are injected through wellbores. |
The image ‘Boundary Conditions coupled three’ demonstrates boundary conditions for coupled three field equations. A more detailed displacement and traction boundary conditions for the stress field are plotted in 2D in the image. |
Fracture Intensity:
| Description | P32 [1/m] | [%] |
| South striking moderately dipping west | 0.42 | 36.10% |
| East striking steeply dipping south | 0.35 | 30.10% |
| SSW striking vertical | 0.19 | 16.60% |
| North striking steeply dipping east | 0.2 | 17.20% |
| 1.15 | 100.00% |
Orientation:
| Mean Trend | Mean Plunge | Mean Strike | Mean Dip | Fisher Concentration | Description |
| 88.5 | 46 | 178.5 | 44 | 15 | South striking moderately dipping west |
| 1.5 | 13.5 | 91.5 | 76.5 | 30 | East striking steeply dipping south |
| 131 | 5 | 221 | 85 | 30 | SSW striking vertical |
| 260 | 17 | 350 | 73 | 10 | North striking steeply dipping east |
Initial reservoir properties used in the native state model were taken directly from characterization data when possible. In many cases, a range of possible values were available, and the mean or median was used, with the values being adjusted within the measured range during model calibration. In all cases, uniform reservoir properties are used within the alluvium. For the granitoid, heterogeneous property distributions are applied where appropriate and data are available. Tables below summarize the property values used. These are the “reference” values for the current state of FORGE.
| Parameter | Units | Source/Comment | Link to data | |
| Compressibility | 1/kPA | 2.52E-12 | Upscaled DFN | |
| Kii (N25E) | m2 | 1.00E-18 | Core and reservoir testing, upscaled DFN | 1160 |
| Kjj (N25E) | m2 | 1.00E-18 | Core and reservoir testing, upscaled DFN | 1160 |
| Kkk (N25E) | m2 | 1.00E-18 | Core and reservoir testing, upscaled DFN | 1160 |
| Porosity | — | 1.00E-03 | Core and cuttings analysis, upscaled DFN | 1052 |
| Rock grain density | kg/m3 | 2750 | 1052 | |
| Specific heat capacity | J/kg K | 790 | ||
| Grain thermal conductivity | W/m K | 3.05 | 58-32 thermal conductivity data | |
| Young’s Modulus | Pa | 6.50E+10 | Core analysis | 1162 |
| Drained Poisson’s Ratio | — | 0.3 | Core analysis | 1162 |
| Undrained Poisson’s Ratio | — | 0.35 | Assume B=0.8 | |
| Biot coef | — | 0.47 | Literature | |
| Thermal expansion coef | — | 6.00E-06 | ||
| Mode 1 fracture toughness | MPa √m | 2.48 | 1162 |
| Parameter | Units | Value | Source/Comment | Link to data |
| K | m2 | 1.70E-14 | Aquifer test | 1140 |
| Porosity | — | 0.12 | Core cuttings analysis, native state calibration | 1052 |
| Rock grain density | kg/m3 | 2500.0 | Core cuttings analysis, native state calibration | 1052 |
| Specific heat capacity | J/kg K | 830.0 | Literature | |
| Grain thermal conductivity | W/m K | 2.0 | Core cuttings analysis, native state calibration | 58-32_thermal conductivity data |
| Young’s Modulus | Pa | 3.0E10 | Literature | |
| Drained Poisson’s Ratio | — | 0.30 | Literature | |
| Biot coef | — | 0.60 | Literature | |
| Thermal expansion coef | — | 2.00E-06 | Literature |
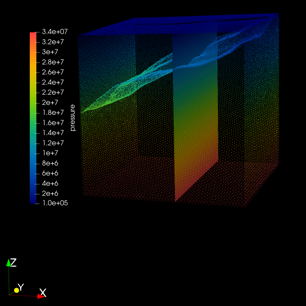
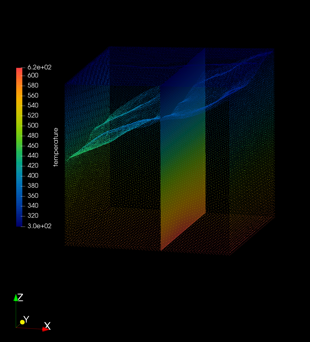
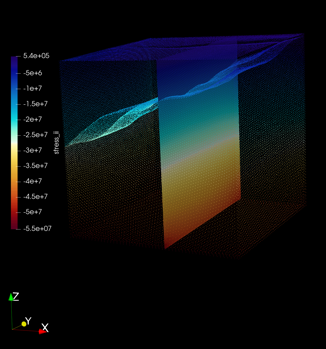
The input script of the finite element model for running in MOOSE and FALCON can be downloaded here (\data_file\p3_ns_model_input_script.i). The images to the left from the top to the bottom present contoured results for the pore pressure for the fluid flow field, temperature for the thermal field, the vertical effective normal stress in the Z-direction, the horizontal effective normal stress in the X-direction, the horizontal effective stress in the Y-direction, the shear stress in Y-Z plane along vertical direction, the mean stress (hydrostatic pressure), and von Mises stress for the solid field obtained from the native steady state model. All predicted field variables in the contours exhibit a linear distribution over the vertical direction where the minimum is on the top surface and the maximum is on the bottom surface. However, it also shows that all these pressure, temperature, and stresses exhibit appreciable variations along the horizontal direction. Furthermore, due to the applied shear traction besides the normal pressure traction boundary condition for the solid field, the stress shows a more significant variation across the interface between the sediment and granitoid. The shear stress level is roughly 10% of the vertical normal stress. Native Steady State modeling results can be downloaded here.
 |
 |
 |
 |
 |
 |
 |
 |
The above native steady state model results are based on a series of calibrations that adjust some parameters to make the predicted field variables closely match the field measurements along wellbores. For example, the far field bottom temperature is slightly raised and the predicted distribution of temperature matches the temperature recorded from well logging. Importantly, it is evaluated from field fracture tests that the maximum principle stress is not exactly along the vertical direction but slightly rotates about either the maximum horizontal stress axis or the minimum horizontal stress axis. However, it is undetermined that this rotation is about which axis. By running various models with different boundary conditions, it is suggested that such a rotation is around the minimum horizontal stress axis.
 |
 |
 |
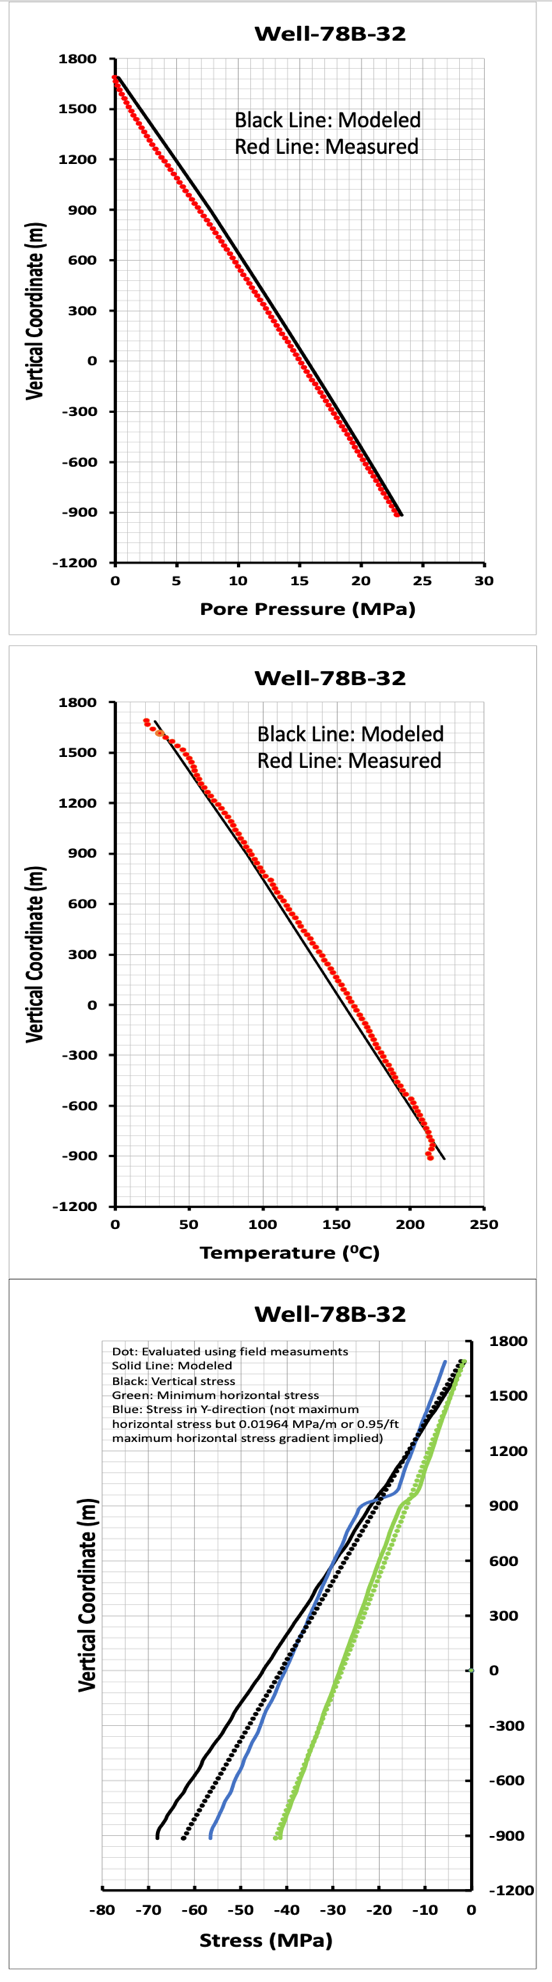 |
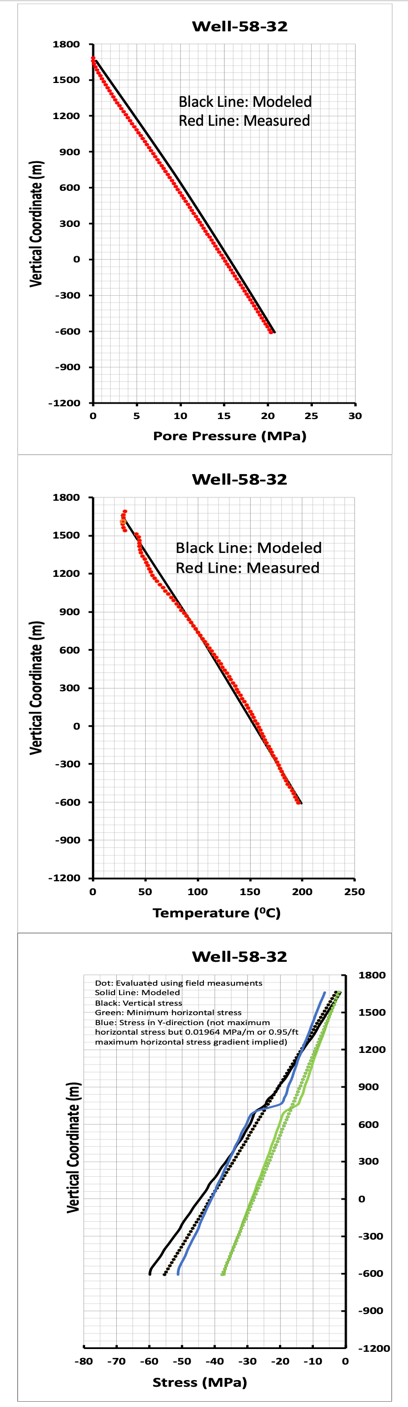
The images above show the comparisons between the measured pore pressure, and temperature, field stresses and the model predicted pore pressure, and temperature, field stresses from the native static model for Wells 56-32, 58-32, 16A, 78B-32, and 78-32. General speaking, they match well except near the ground surface or on the bottom.
 |
Boundary conditions for pressure, temperature, and stress were based on results obtained and compiled during Phase 2, which relied on both new data collection and information obtained from the literature. Due to the complex nature of the distributions of pressure, temperature, and stress, all boundary conditions in the native state model have varying degrees of spatial variability, which were implemented using Dirichlet conditions. Boundary conditions can be downloaded here. |
|
Initial pore pressure and temperature conditions used for the native state model were based on estimates in the earth model and assigned to the numerical model cells in a similar fashion used to assign the boundary conditions. Values for pore pressure were estimated based on the top boundary condition and interpolated downward as a function of depth. Temperate was directly interpolated from the earth model to the numerical model cells. Initial pore pressure and temperature conditions can be downloaded here. The image to the left shows the temperature applied to top of the model domain in degrees Celsius, in the local coordinate system implementation of the native state model. The location of Well 58-32 is shown for reference. |
|
|
Initial stress conditions used for the native state model are based on calculations of the displacement of the rock matrix, and as such, are difficult to assign a priori. A value of zero displacement is assigned as an initial condition, letting the model iterate a few extra times to come to a converged solution. Initial stress conditions can be downloaded here. The image to the left shows the total pressure applied to top of the model domain in megapascals, in the local coordinate system implementation of the native state model. The location of Well 58-32 is shown for reference. |
|
 |
A representative population of natural fractures are included in the reference Discrete Fracture Network Model (DFN), which incorporates measured surface and well data to create planer fractures that communicate as a single hydrological and mechanical system. The reference DFN consists of a deterministic set of fractures intersecting Well 58-32 where fracture locations and orientations are known, plus a stochastic set of fractures away from well control. The image to the left shows the orientations of the fractures in the reference DFN in an upper hemisphere stereonet (plotting fracture poles). The table below provides a summary of the three fracture sets identified. |
| EW Vertical | NS Inclined Dipping West | NE Steeply Dipping SE | ||
| Set Intensity | P32 [1/m] | 0.78 | 1.41 | 0.31 |
| [%] | 31 | 56 | 12 | |
| Mean Set Orientation | Strike [deg] | 96 | 185 | 215 |
| Dip [deg] | 80 S | 48 W | 64 SE |
| Parameter | Units | Min | Max | Source/Comment | Link to data |
| Compressibility | 1/kPA | 2.52E-12 | 8.51E-08 | Upscaled DFN | |
| Kii (N25E) | m2 | 1.75E-21 | 1.20E-16 | Core and reservoir testing, upscaled DFN | 1160 |
| Kjj (N25E) | m2 | 2.44E-21 | 1.28E-16 | Core and reservoir testing, upscaled DFN | 1160 |
| Kkk (N25E) | m2 | 2.93E-21 | 1.10E-16 | Core and reservoir testing, upscaled DFN | 1160 |
| Porosity | — | 1.00E-07 | 0.0118 | Core and cuttings analysis, upscaled DFN | 1052 |
| Rock grain density | kg/m3 | 2750.0 | Core and cuttings analysis, native state calibration | 1052 | |
| Specific heat capacity | J/kg K | 790.0 | Literature | ||
| Grain thermal conductivity | W/m K | 3.05 | Core and cuttings analysis, native state calibration | 58-32 thermal conductivity data | |
| Young’s Modulus | Pa | 5.50E+10 | 6.20E+10 | Core analysis | 1162 |
| Drained Poisson’s Ratio | — | 0.26 | 0.3 | Core analysis | 1162 |
| Undrained Poisson’s Ratio | — | 0.35 | 0.4 | Assume B=0.8 | |
| Biot coef | — | 0.5 | 0.7 | Literature | |
| Thermal expansion coef | — | 2.00E-06 | Literature | ||
| Mode 1 fracture toughness | MPa √m | 2.48 | Core analysis | 1162 | |
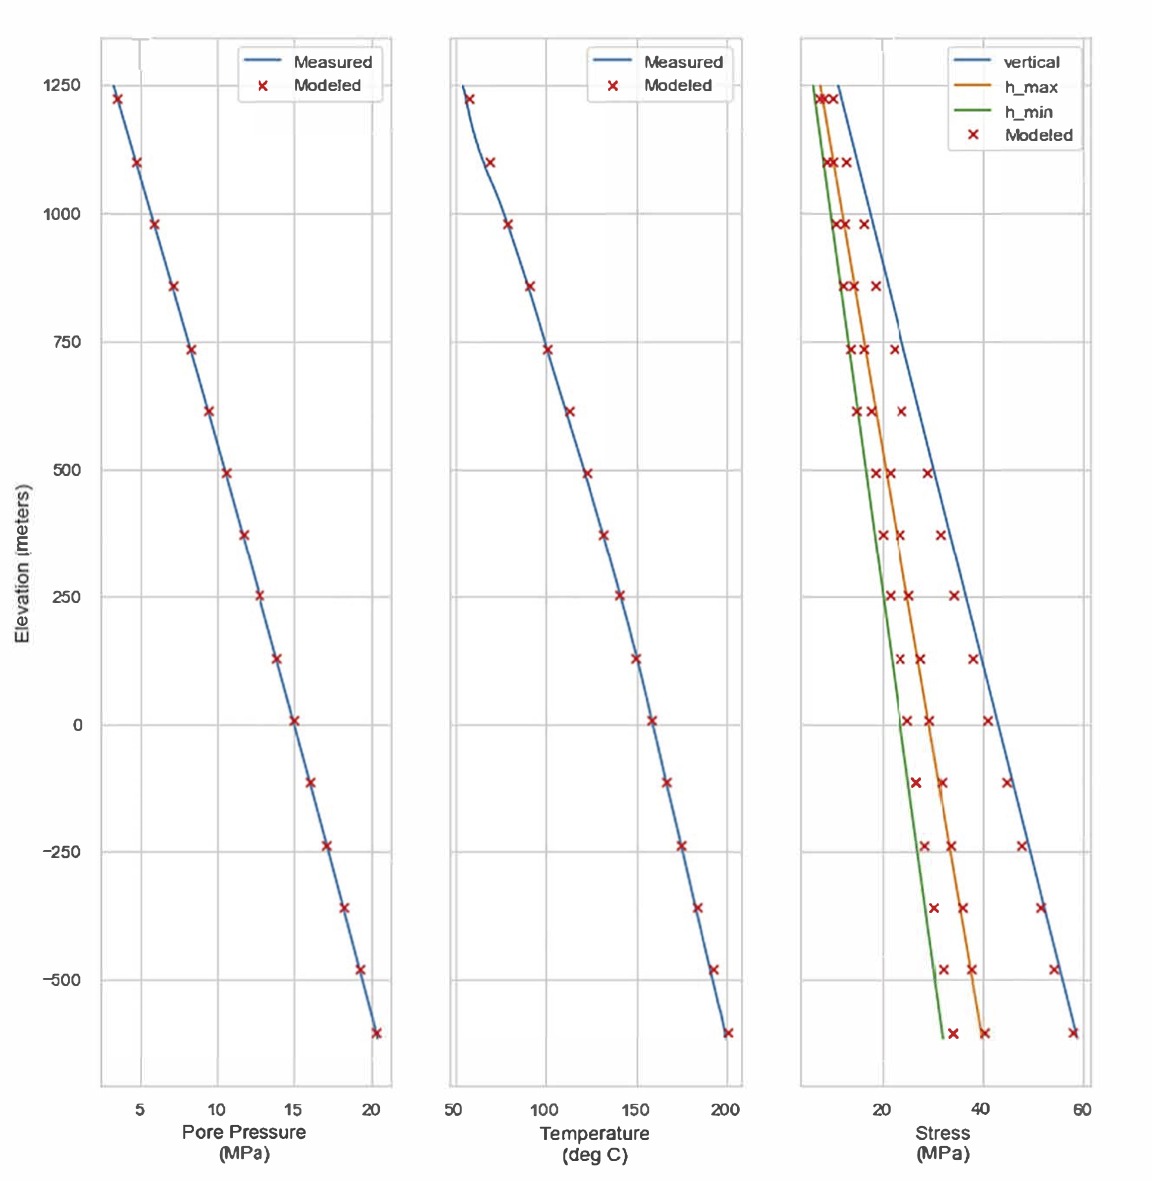 |
The modeled pressure, temperature, and stress along the trajectory of Well 58-32 match the field measured data reasonably well. The pressure distribution is largely linear along the length of Well 58-32 within the model domain and shows little to no differentiation between the overlying sedimentary basin fill and the granitoid-hosted reservoir. The modeled temperature distribution also matches the field measured data and shows a break in slope at the sediment fill-granitoid contact.
The image to the left shows subsampled results for the pore pressure, temperature, and stress obtained in the native state model (red X). Also shown are values from logging and testing Well 58-32 (lines). Note that the pore pressure and temperature were logged over the entire length of Well 58-32, while the stress is estimated from injection tests in the toe. |
| The vertical stress was calibrated by adjusting the sediment density and porosity, as well as the density of the granitoid within the range of measured values until the modeled vertical stress match the field measurements at the toe of Well 58-32. Native State modeling results can be downloaded here.
The image to the left shows the estimated total vertical stress within the granitoid. |
|
Boundary conditions for pressure, temperature, and stress were based on results obtained and compiled during Phase 2, which relied on both new data collection and information obtained from the literature. Due to the complex nature of the distributions of pressure, temperature, and stress, all boundary conditions in the native state model have varying degrees of spatial variability, which were implemented using Dirichlet conditions. Boundary conditions can be downloaded here. |
|
Initial pore pressure and temperature conditions used for the native state model were based on estimates in the earth model and assigned to the numerical model cells in a similar fashion used to assign the boundary conditions. Values for pore pressure were estimated based on the top boundary condition and interpolated downward as a function of depth. Temperate was directly interpolated from the earth model to the numerical model cells. Initial pore pressure and temperature conditions can be downloaded here. The image above shows the temperature applied to top of the model domain in degrees Celsius, in the local coordinate system implementation of the native state model. The location of Well 58-32 is shown for reference. |
|
Initial stress conditions used for the native state model are based on calculations of the displacement of the rock matrix, and as such, are difficult to assign a priori. A value of zero displacement is assigned as an initial condition, letting the model iterate a few extra times to come to a converged solution. Initial stress conditions can be downloaded here. The image above shows the total pressure applied to top of the model domain in megapascals, in the local coordinate system implementation of the native state model. The location of Well 58-32 is shown for reference. |
|
A representative population of natural fractures are included in the reference Discrete Fracture Network Model (DFN), which incorporates measured surface and well data to create planer fractures that communicate as a single hydrological and mechanical system. The reference DFN consists of a deterministic set of fractures intersecting Well 58-32 where fracture locations and orientations are known, plus a stochastic set of fractures away from well control. The image above shows the orientations of the fractures in the reference DFN in an upper hemisphere stereonet (plotting fracture poles). The table below provides a summary of the three fracture sets identified. |
| EW Vertical | NS Inclined Dipping West | NE Steeply Dipping SE | ||
| Set Intensity | P32 [1/m] | 0.78 | 1.41 | 0.31 |
| [%] | 31 | 56 | 12 | |
| Mean Set Orientation | Strike [deg] | 96 | 185 | 215 |
| Dip [deg] | 80 S | 48 W | 64 SE |
| Parameter | Units | Min | Max | Source/Comment | Link to data |
| Compressibility | 1/kPA | 2.52E-12 | 8.51E-08 | Upscaled DFN | |
| Kii (N25E) | m2 | 1.75E-21 | 1.20E-16 | Core and reservoir testing, upscaled DFN | 1160 |
| Kjj (N25E) | m2 | 2.44E-21 | 1.28E-16 | Core and reservoir testing, upscaled DFN | 1160 |
| Kkk (N25E) | m2 | 2.93E-21 | 1.10E-16 | Core and reservoir testing, upscaled DFN | 1160 |
| Porosity | — | 1.00E-07 | 0.0118 | Core and cuttings analysis, upscaled DFN | 1052 |
| Rock grain density | kg/m3 | 2750.0 | Core and cuttings analysis, native state calibration | 1052 | |
| Specific heat capacity | J/kg K | 790.0 | Literature | ||
| Grain thermal conductivity | W/m K | 3.05 | Core and cuttings analysis, native state calibration | 58-32 thermal conductivity data | |
| Young’s Modulus | Pa | 5.50E+10 | 6.20E+10 | Core analysis | 1162 |
| Drained Poisson’s Ratio | — | 0.26 | 0.3 | Core analysis | 1162 |
| Undrained Poisson’s Ratio | — | 0.35 | 0.4 | Assume B=0.8 | |
| Biot coef | — | 0.5 | 0.7 | Literature | |
| Thermal expansion coef | — | 2.00E-06 | Literature | ||
| Mode 1 fracture toughness | MPa √m | 2.48 | Core analysis | 1162 | |
|
The modeled pressure, temperature, and stress along the trajectory of Well 58-32 match the field measured data reasonably well. The pressure distribution is largely linear along the length of Well 58-32 within the model domain and shows little to no differentiation between the overlying sedimentary basin fill and the granitoid-hosted reservoir. The modeled temperature distribution also matches the field measured data and shows a break in slope at the sediment fill-granitoid contact. The image above shows subsampled results for the pore pressure, temperature, and stress obtained in the native state model (red X). Also shown are values from logging and testing Well 58-32 (lines). Note that the pore pressure and temperature were logged over the entire length of Well 58-32, while the stress is estimated from injection tests in the toe. |
|
The image above shows the estimated total vertical stress within the granitoid. |